
分析反应性 {🚀}
¥Analyzing reactivity {🚀}
使用 trace 进行调试
¥Using trace for debugging
Trace 是一个小实用程序,可帮助你找出计算值、反应或组件重新评估的原因。
¥Trace is a small utility that helps you find out why your computed values, reactions or components are re-evaluating.
只需导入 import { trace } from "mobx",然后将其放入反应或计算值中即可使用它。它将打印出为什么要重新评估当前的推导。
¥It can be used by simply importing import { trace } from "mobx", and then putting it inside a reaction or computed value.
It will print why it is re-evaluating the current derivation.
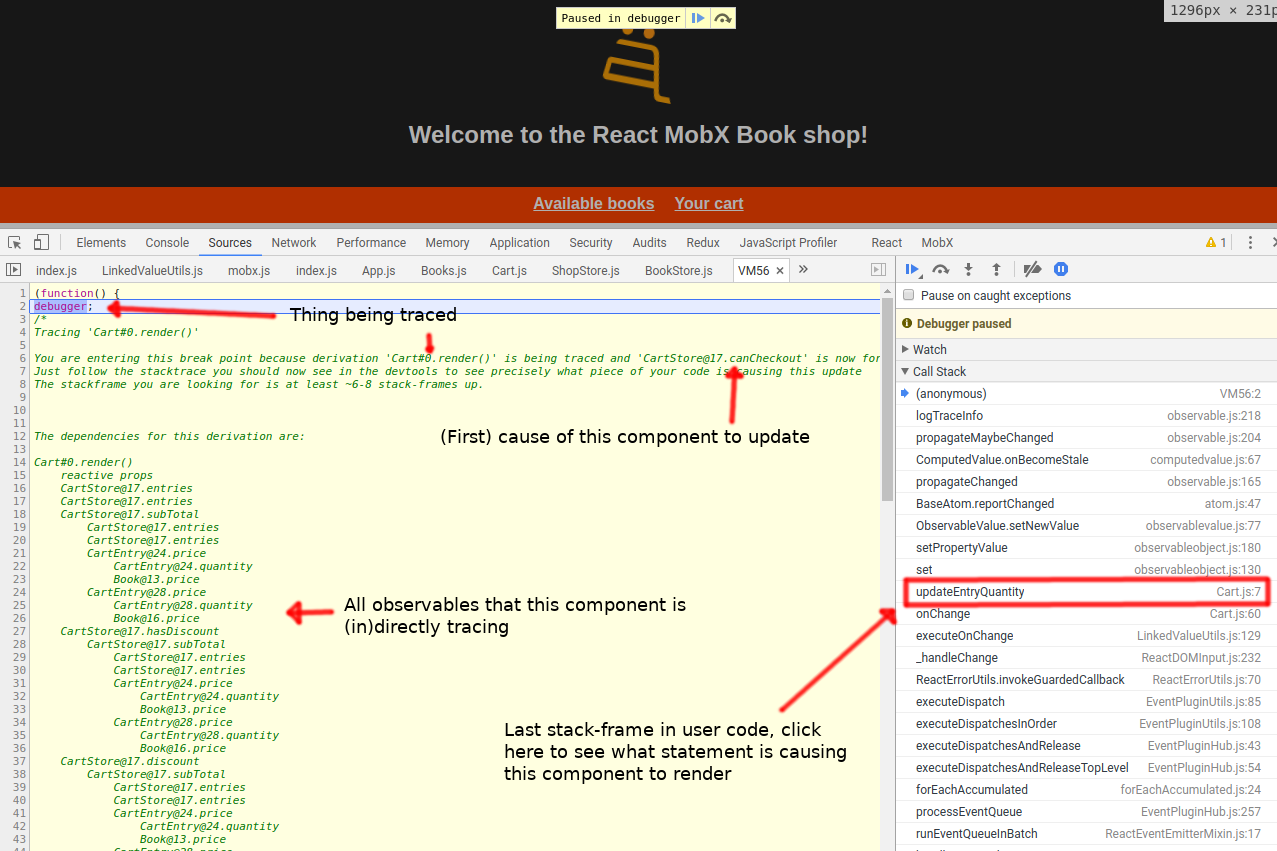
(可选)可以通过传递 true 作为最后一个参数来自动进入调试器。这样,导致反应重新运行的确切突变仍将位于堆栈中,通常约为 8 个堆栈帧。请参见下图。
¥Optionally it is possible to automatically enter the debugger by passing true as the last argument.
This way the exact mutation that causes the reaction to re-run will still be in stack, usually ~8 stack frames up. See the image below.
在调试器模式下,调试信息还将揭示影响当前计算/反应的完整推导树。
¥In debugger mode, the debug information will also reveal the full derivation tree that is affecting the current computation / reaction.
在线示例
¥Live examples
¥Simple CodeSandbox trace example.
这是一个部署的示例 用于探索堆栈。确保使用 chrome 调试器的黑盒功能!
¥Here's a deployed example for exploring the stack. Make sure to play with the chrome debugger's blackbox feature!
使用示例
¥Usage examples
调用 trace() 的方式有多种,例如:
¥There are different ways of calling trace(), some examples:
import { observer } from "mobx-react"
import { trace } from "mobx"

const MyComponent = observer(() => {
    trace(true) // Enter the debugger whenever an observable value causes this component to re-run.
    return <div>{this.props.user.name}</name>
})
使用反应/自动运行的 reaction 参数启用跟踪:
¥Enable trace by using the reaction argument of a reaction / autorun:
mobx.autorun("logger", reaction => {
    reaction.trace()
    console.log(user.fullname)
})
传入计算属性的属性名称:
¥Pass in the property name of a computed property:
trace(user, "fullname")
自省 API
¥Introspection APIs
如果你想在调试时检查 MobX 的内部状态,或者想在 MobX 之上构建很酷的工具,那么以下 API 可能会派上用场。同样相关的是各种 isObservable* API。
¥The following APIs might come in handy if you want to inspect the internal state of MobX while debugging, or want to build cool tools on top of MobX.
Also relevant are the various isObservable* APIs.
getDebugName
用法:
¥Usage:
getDebugName(thing, property?)
返回可观察对象、属性、反应等的(生成的)友好调试名称。例如由 MobX 开发者工具 使用。
¥Returns a (generated) friendly debug name of an observable object, property, reaction etc. Used for example by the MobX developer tools.
getDependencyTree
用法:
¥Usage:
getDependencyTree(thing, property?)。
返回一个树结构,其中包含给定反应/计算当前依赖的所有可观察值。
¥Returns a tree structure with all observables the given reaction / computation currently depends upon.
getObserverTree
用法:
¥Usage:
getObserverTree(thing, property?)。
返回一个树结构,其中包含观察给定可观察量的所有反应/计算。
¥Returns a tree structure with all reactions / computations that are observing the given observable.
getAtom
用法:
¥Usage:
getAtom(thing, property?)。
返回给定可观察对象、属性、反应等的支持原子。
¥Returns the backing Atom of a given observable object, property, reaction etc.
间谍
¥Spy
用法:
¥Usage:
spy(listener)
注册一个全局间谍监听器,用于监听 MobX 中发生的所有事件。它类似于一次将 observe 监听器附加到所有可观察量,但也会通知有关运行(传输/重新)操作和计算的信息。例如由 MobX 开发者工具 使用。
¥Registers a global spy listener that listens to all events that happen in MobX.
It is similar to attaching an observe listener to all observables at once, but also notifies about running (trans/re)actions and computations.
Used for example by the MobX developer tools.
监视所有操作的示例用法:
¥Example usage of spying all actions:
spy(event => {
    if (event.type === "action") {
        console.log(`${event.name} with args: ${event.arguments}`)
    }
})
间谍监听器始终接收一个对象,该对象通常至少有一个 type 字段。默认情况下,spy 会发出以下事件:
¥Spy listeners always receive one object, which usually has at least a type field. The following events are emitted by default by spy:
| 类型 | observableKind | 其他字段 | 嵌套 |
|---|---|---|---|
| action | name, object (scope), arguments[] | yes | |
| scheduled-reaction | name | no | |
| reaction | name | yes | |
| error | 名称、消息、错误 | no | |
| 添加、更新、删除、删除、拼接 | 看看 拦截并观察 {🚀} | yes | |
| report-end | spyReportEnd=真,时间?(总执行时间以毫秒为单位) | no |
report-end 事件是 spyReportStart: true 之前触发的事件的一部分。此事件指示事件的结束,并通过这种方式创建带有子事件的事件组。此事件还可能报告总执行时间。
¥The report-end events are part of an earlier fired event that had spyReportStart: true.
This event indicates the end of an event and this way groups of events with sub-events are created.
This event might report the total execution time as well.
可观察值的间谍事件与传递给 observe 的事件相同。在生产版本中,spy API 是无操作的,因为它将被最小化。
¥The spy events for observable values are identical to the events passed to observe.
In production builds, the spy API is a no-op as it will be minimized away.
查看 拦截并观察 {🚀} 部分以获取广泛的概述。
¥Check out the Intercept & observe {🚀} section for an extensive overview.